The huge and increasing number of quasars reckoned from various sky surveys leads to a large quantity of data which brings various and inhomogeneous information in the fields of astrometry, photometry, radioastronomy and spectroscopy.
We gather the 12 largest quasar catalogues (4 from radio interferometry programs, 8 from optical surveys), and we carry out systematic cross-identifications of the objects. Informations concerning u, b, v, g, r, i, z, J, K photometry as well as redshift and radio fluxes at 1.4 GHz, 2.3 GHz, 5.0 GHz, 8.4 GHz and 24 GH are given when available. A small proportion of remaining objects, not reckoned by the 12 catalogues and included in the Veron-Cetty & Veron quasar catalogues, are added in the compilation.
The LQAC contains 113666 quasars. We discuss the external homogeneity of the data by comparing the equatorial coordinates, the redshifts and the magnitudes of objects belonging to different catalogues. At last we use up-to-date cosmological parameters as well as recent models for galactic extinction and K-correction in order to evaluate the absolute magnitudes of the objects.
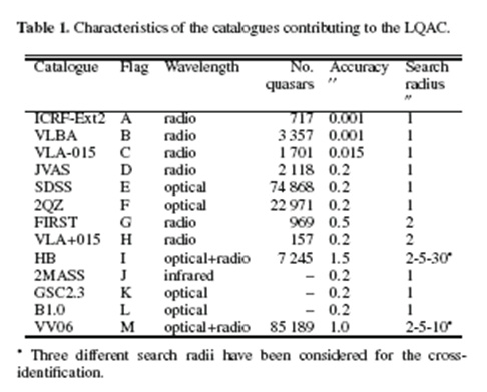
Characteristics of the catalogues participating to the LQAC
In this table, the A--M flags are the individual compiled catalogues . The first four catalogues have an optimal astrometric quality due to the fact that the quasar coordinates have been determined from very long baseline interferometry (VLBI) for A and B or from a dense network of radio antennas (C and D). The flag order roughly corresponds to a decreasing accuracy in the position of the quasars. Note that the 2MASS, B1.0 and GSC2.3 do not provide a specific list of quasars, therefore they do not participate in the addition of new quasars with respect to the other catalogues. However they are used to bring supplementary accurate information concerning photometry (for instance 2MASS at infrared wavelengths). We have deliberately splitted the VLA out in two sub catalogues with designations C and H to distinguish two levels of astrometric accuracy: in the VLA-0.15 this accuracy is smaller than 0.15 arcsec, whereas in the VLA+0.15 the accuracy is below this value. At last, VV06 is used as a final remedy in order to include all the quasars which are not present in any of the catalogues from A to L, for completeness purpose.
Contribution per item for each individual catalogue used to construct the LQAC
This table indicates, for a given item and a given catalogue the number of sources included in the LQAC. We remark that the SDSS contribution is leading by far for the u, g, r, i, z magnitudes as well as for the redshift. It is exclusive in the case of g and z magnitudes. The contribution of the GSC2.3 catalogue has been determinant for the b and v magnitudes (respectively 72% and 88% of the total available values). For the radio information, a large majority of fluxes at 2.3 GHz and 8.4 GHz are coming from the VLBA survey. The items with the largest number of non zero values are the redshift z, with 89% of the 113 666 quasars of the LQAC, followed with the r magnitude (88%) then the u and b ones (85%). The infrared information given from 2MASS correspond to 12% of our total sample.

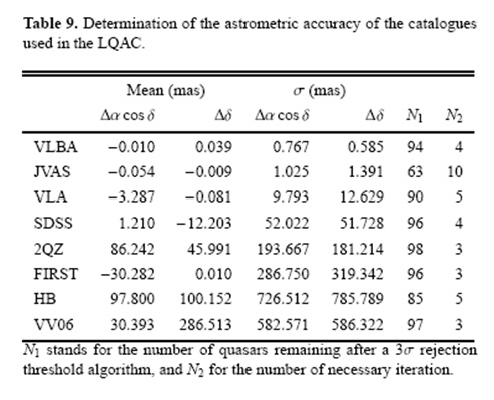
Determination of the astrometric accuracy of the catalogues used in the LQAC
This Table gives the mean, the standard deviations, the percentage of kept quasars after the final 3 sigma cut-off, as well as the number of required iterations. We notice that even if the convergence of the standard deviations with the 3 sigma cut-off is very fast for most of the comparisons (3 or 4 iterations), however for the VLA and HB, the convergence needs 5 iterations and almost 10% of cross-identified quasars are not considered. For the JVAS catalogue, it is worse: the standard deviations do not converge even after 10 iterations and more than 35% of rejected quasars. This problem can be associated with a non-gaussian distribution of the differences. To eliminate the effects related to non-gaussian distribution on the determination of standard deviations, we try to numerically estimate the density law corresponding to each dot set by using the kernel smoothing density function (Bowman & Azzalini 1997). By integrating these functions we determine the most narrow areas which correspond to respectively to 50% and 80% of probability.
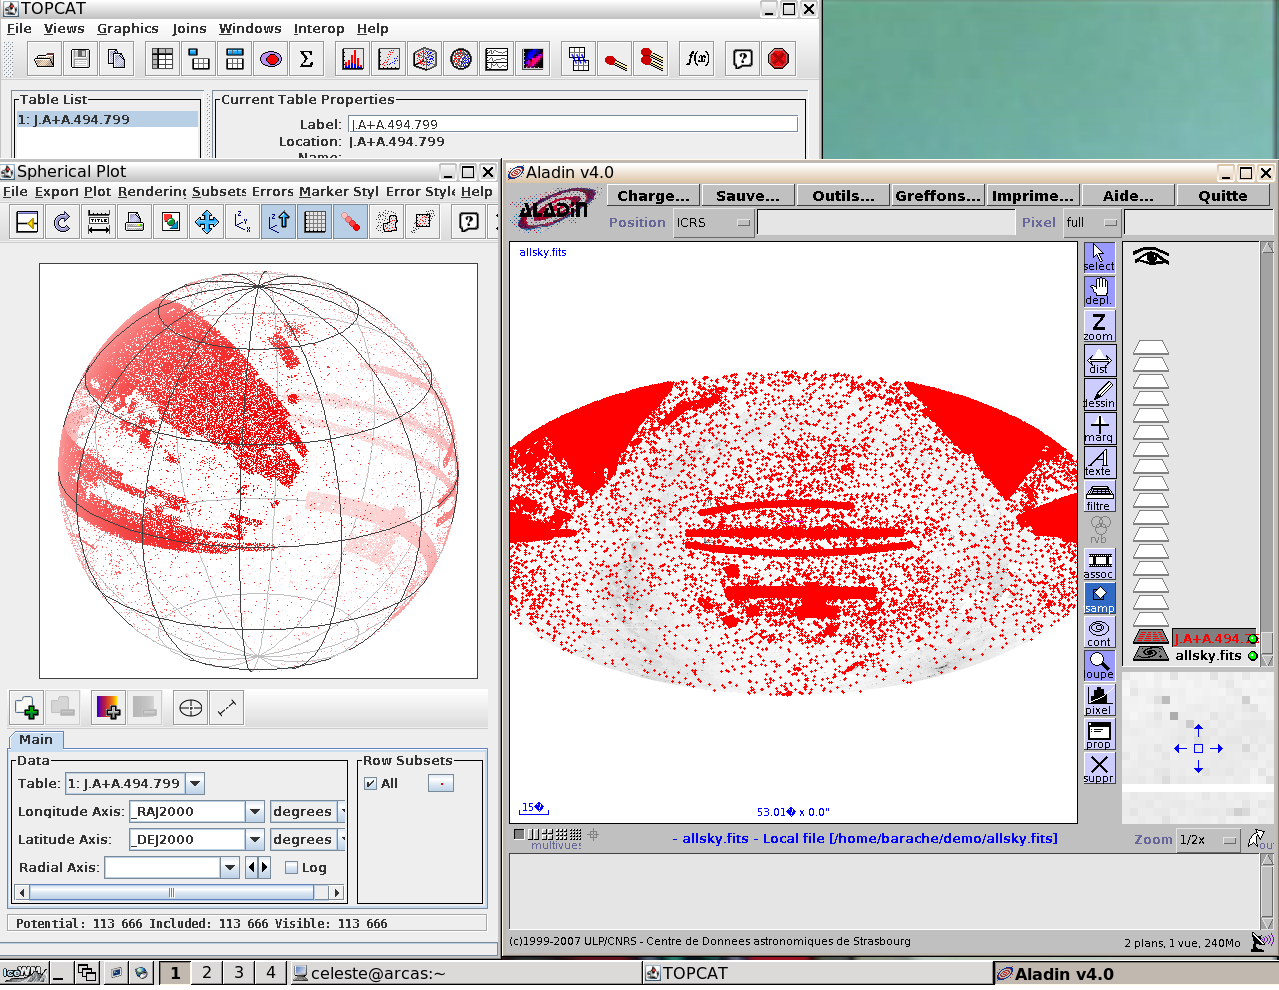
The LQAC vizualised by Aladin and TopCat VO Tools
We made use of Aladin, a freeware tool provided by the CDS, to manipulate star or quasar catalogues and data imaging associated to with these objects for preliminary studies and for the spatial plotting of quasars in the catalogues involved in the compilation. To validate our tools and input data, two different software packages have been used for cross identification and data processing but dealing with the same parameters and strategy: (i) homemade FORTRAN programs, and (ii) scripts using Virtual Observatory tools named Stilts and Topcat.
LQAC data, from Syrte, in ASCII format
LQAC data, from CDS, in VO (Virtual Observatory) format
LQAC paper Astronomy & Astrophysic 2009, from ADS, in PAPER